CGC Estimated Market Capitalisation (CGCEMC): A Next Generation Metric
This is the fourth article on the topic of CGC Average Market Capitalization (CGCAMC). The introductory article was published in November 2020 at this link. < https://comics.gpanalysis.com/... > The second article was published December 2020 at this link. < https://comics.gpanalysis.com/... > The third article was published January 2021 at this link. < https://comics.gpanalysis.com/... >
As a brief review, the CGCAMC is the calculation of a total dollar amount for the number (N) of CGC graded copies of a comic book multiplied by the average price (P) for the average CGC universal grade of that comic book. CGCAMC is simply N times P. CGCAMC does not represent the total value of all copies of a comic book, but it does provide a result that allows comparison between average copies of comic books which may be very different values with very different numbers of copies graded. The premiums (and record prices) paid for higher grades are not included in CGCAMC calculation for averages.
If the price of a CGC graded comic was a simple as the CGC grade multiplied by some “base dollar amount” (price per point), the price of the average CGC grade would accurately represent an average for all CGC graded copies. For example, a CGC 6.0 that sells for $600 would have a CGC 7.0 that sells for $700 and a CGC 5.0 that sells for $500, using $100 per point. This pricing pattern does happen quite often according to GPAnalysis.com recorded sales, but the simple calculation for “price per point” doesn’t work at the highest CGC grades. When a CGC 6.0 sells for $600, is it easy to see how a CGC 7.0 might sell for $700, but more than twenty years of CGC grading and market activity make it clear that a CGC 9.0 of the same book would sell for much more than $900.
WHEN CGCAMC ISN’T ENOUGH
Using the CGC 6.0 as $600 example, the CGC 5.0 to CGC 7.0 prices for Amazing Spider-Man #18 (1964) fit this general pattern of $100 per point. The average CGC universal grade is 5.97. The most recent sale of CGC 6.0 was $580, the most recent CGC 7.0 was $720, and a recent sale for CGC 5.0 was $516. The patten continues moving down the grading scale, as the most recent sale of CGC 2.0 was $190. The price for CGC 9.0, however, has averaged $1,800 for the past three sales, with the most recent sale at $2,000. At the highest extreme, two sales of CGC 9.8 Amazing Spider-Man #18 in the past month have averaged $20,000.
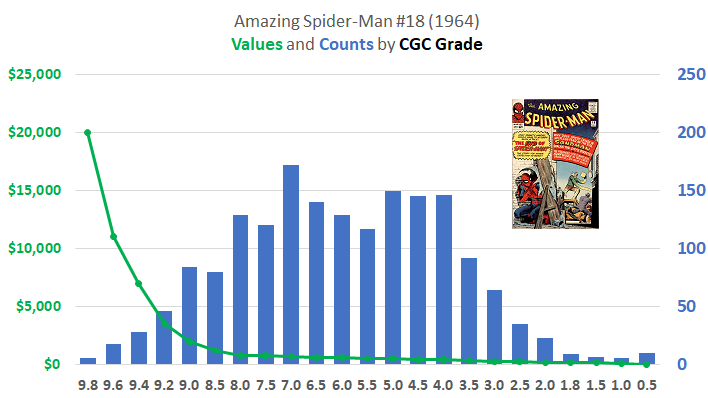
How does CGCAMC compare to the total dollar value of all CGC graded copies for Amazing Spider-Man #18?
The total dollar value (full market capitalization) for Amazing Spider-Man #18 universal and signature series (valued as universal, ignoring signature premiums) would be $1,835,920, using GPAnalysis.com recorded sales and reasonable estimates for ‘in-between’ grades for all 23 grades populated between CGC 0.5 and CGC 9.8. In contrast, the CGCAMC value provides an average CGC grade price multiplied by the total CGC counts, which represents the value of grades below premium pricing at the upper end of the grading scale. The total CGCAMC for Amazing Spider-Man #18 is $1,174,299, which is the product of $597 for the CGC average grade of 5.97 and the number of CGC graded copies, 1,967.
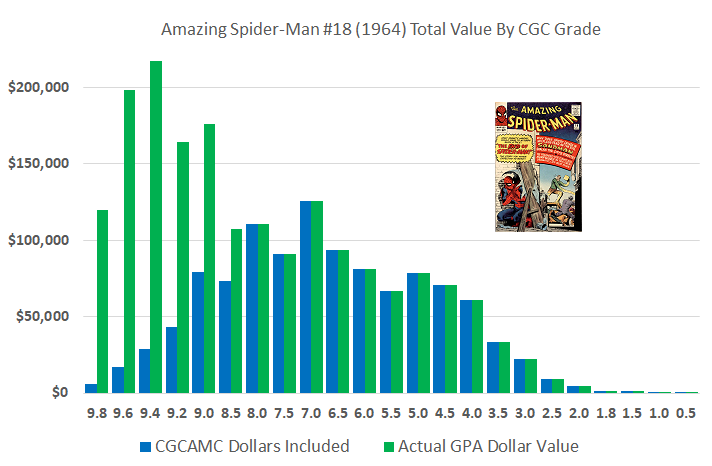
The premium prices paid according to GPAnalysis.com show the gap between the CGCAMC calculation and the full market capitalization as the green extended bars in the graphic above. In this case, the CGCAMC value ($1,174,299) is 64% of the calculated total CGC dollar value of Amazing Spider-Man #18 universal and signature series ($1,835,920). Amazing Spider-Man #18 (1964) is just one example of these calculations, and the difference between the CGCAMC value and the calculated GPAnalysis.com total value is often correlated with the publication year of the comic. The 64% also corresponds to the publication year of the comic, 1964. The CGCAMC value would better represent the full market capitalization if an adjustment of 64% were introduced to estimate the market capitalization.
For older comic books, particularly the key issues of Action Comics #1 and Detective Comics #27, the CGCAMC calculation represents only about 40% of the full market capitalization, and a similar adjustment using the publication year would be in order, which would be 38% for Action Comics #1 (1938) and 39% for Detective Comics #27 (1939). Likewise, newer comic books often have higher average CGC grades, and the CGCAMC adjustment required would be closer to the upper end of the CGC grading scale. The CGCAMC value for comic books from 1974 would be adjusted by 74%, and comic books from 1988 would be adjusted by 88%. These adjustments have been checked against GPAnalysis.com calculated total market values and are generally valid using the comic publication year for the adjustment. There are exceptions to any rule, but as far as market capitalization goes, this adjusted estimated market capitalization is much closer than the CGCAMC calculation.
This adjustment of CGCAMC to create an estimated market capitalization (EMC) can be represented as a division by a percentage. Because CGCAMC is only about 64% of the calculated total market capitalization of Amazing Spider-Man #18, the CGCAMC value needs to be divided by 64% to obtain an estimated market capitalization (EMC). It would be equally valid to multiply the CGCAMC by 1.5625 instead of dividing by 64%, but for aesthetic purposes (since the math is the same), dividing by 64% is more “pleasing” than multiplying by 1.5625. It is particularly more “pleasing” when the item being evaluated is from 1964.
The calculation of a CGC Estimated Market Capitalization (CGCEMC) is an adjustment of the CGCAMC result. The adjustment is to divide CGCAMC by the two-digit year of the comic book represented as a percentage. CGCAMC values for books from 1964 would be divided by 64%. CGCAMC values for books from 1938 would be divided by 38%. CGCAMC values for books from 1996 would be divided by 96%, etc. Comics printed after 2000 will have CGCAMC = CGCEMC, as a rule, unless a discounted CGCAMC value would be more appropriate in future years. Dividing CGCAMC by 113%, for example, for comic books from 2013 would lower the CGCEMC to a value below CGCAMC.
The current calculations for CGCAMC and CGCEMC are shown below. The prior article in this series had significantly lower CGCAMC values at the end of year for 2020. Through the first nine months of 2021, many of the top books have doubled their average universal grade prices, according to GPAnalysis.com sales records.
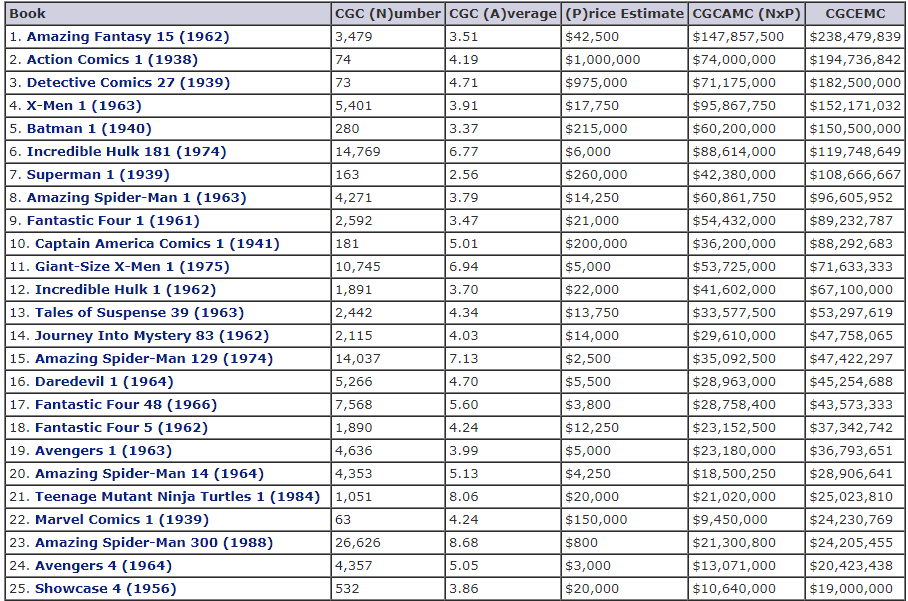
The “Big Three” comic books according to CGCEMC are Amazing Fantasy #15, Action Comics #1, and Detective Comics #27. Most collectors do not need to be reminded which three books are the “Big Three”, but most have probably not seen a dollar amount associated with the CGC graded copies. At the time of this publication, the CGCEMC (estimated market capitalization) values are $238.5 million, $194.7 million, and $182.5 million, respectively. At the end of 2020, in the prior article in this series, the CGCEMC values would have been $112.1 million (Amazing Fantasy #15), $113.7 million (Action #1), and $106.2 million (Detective #27). Overall, 2021 has been a year of significant increases for all three books, but Amazing Fantasy #15 has benefitted the most from market changes.
BUY ME SOME PEANUTS AND CRACKER JACK COMIC BOOKS
It’s fair to say that baseball has a larger fanbase than comic books, with annual revenues from Major League Baseball around $10 billion per year (prior to COVID-19), as opposed to the North American comic book industry’s $1.3 billion in 2020 (source: comichron.com). With such a large fanbase and being “America’s Past-time” for so many decades, baseball enthusiasts have grown accustomed to various statistical metrics and calculations to inform their hobby.
Individual baseball players are known by their batting averages, their home run totals, their earned run average, their years in the league, number of All-Star awards, number of World Series championships, and recent decades have given rise to metrics such as slugging percentage and wins-above-replacement (WAR). Because there is simply too much information for any fan to digest, much less to memorize, about all the players in the league, these metrics (or sabermetrics, as they have become known) provide a quick summary for a player’s season or career in order to compare players to each other or even across eras of baseball history.
The comic book industry has disturbingly few metrics, in this author’s opinion, beyond the individual comic book sale prices which make headlines when they set new world records. Yes, it is true that the most recent sale of CGC 9.6 Amazing Fantasy #15 broke the all-time sale record held by CGC 9.0 Action Comics #1, but where does Amazing Spider-Man #300 rank compared to these two books? We know from the CGC Census that Amazing Spider-Man #300 is the most-submitted comic book of all-time, and we know from GPAnalysis.com and other sales records that prices for individual copies of Amazing Spider-Man #300 do not approach the value of the Big Three comic books, or even most key issues from the Golden, Silver, and Bronze Ages. A quick review of the Top 25 list provided above shows Amazing Spider-Man #300 ranked number 23, just above Avengers #4. CGCAMC and CGCEMC are attempts to bring some “sabermetrics” to comic books like those of the baseball industry.
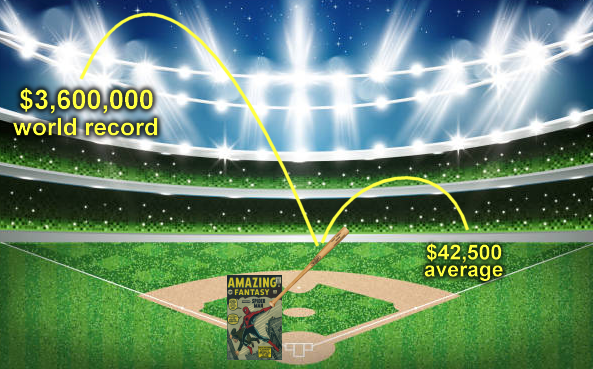
The CGCAMC calculation is similar to a batting average, by considering an average CGC graded copy as a representative of all grades and prices for the book, much the same way that a batting average considers a single, double, triple, and home run as equal in its calculation. No bonus is given in batting average for grand slams (world record comic prices) versus singles (average sales). Other metrics in baseball separate home runs from singles, but the batting average establishes a general baseline for “positive outcomes” relative to other players.
The CGCEMC calculation is similar to slugging percentage, which counts a home run as four bases, a triple as three bases, a double as two bases, and a single as one base, totaling those base counts for each player each season. The slugging percentage becomes a percentage when the total bases are divided by the number of at-bats. CGCEMC attempts to estimate all those premium prices (home runs) in addition to average sales (singles and doubles) for each comic book but does not divide by the number of CGC graded copies. CGCEMC allows the total dollar value estimate to remain as an all-time metric regardless of whether there are 25 copies CGC graded or 25,000.
Much like baseball metrics are often hotly debated, refined, and qualified in their descriptions of what they do and do not represent for the game, the CGCAMC and CGCEMC calculations need to be qualified as “not the whole story” when it comes to metrics about the comic book industry. There is not enough information about the comic book market when analysis simply focuses on the world record sales, or just in watching the CGC Census grow over time. Some blend of the CGC Census and the recorded sales in the market, world records, averages, and everything else, would better inform fans and hobbyists about the comic book industry.
It’s perfectly fine if fans have a favorite player or favorite comic book regardless of any averages and sabermetrics the industry might calculate, but a wider view of all the players/books would establish some standards and comparisons which provide additional knowledge across the eras. Baseball fans have a number of websites providing player statistics and analysis. For comic books, in addition to GPAnalysis.com, the CGC Census, and CGCdata.com, a new website has been established for CGCAMC and CGCEMC at CGCEMC.com. PLAY BALL!
About the Author
 |
Greg Holland has collected comic books for over 30 years and has been the administrator of the CGC Census Analysis website since 2003, currently located at CGCdata.com. He is the 1999 founder of the ValiantComics.com website and the 2004 ValiantFans.com message board. Dr. Holland holds a Ph.D. in information quality from the University of Arkansas at Little Rock and has held data science positions as research director, analyst, and administrator for government, corporations, and university. Active on the CGC Forums as ‘valiantman’ since 2002, he is also a 15+ year advisor to the Overstreet Comic Book Price Guide and contributor to later editions of the Standard Catalog of Comic Books. Greg resides in Arkansas, USA, with his wife and their daughter. |
Related news
24 Oct 2022
Canadian Price Variants (CPVs) and GPAnalysis.com Recorded Sales
With Canadian Price Variants recorded in GPAnalysis.com for decades, what can the data tell us about rarity and value when comparing against direct editions?
Read more26 May 2022
CGC Census - A Game for the Thousandth Collector
Imagine a game where 1,000 lucky comic collectors are awarded the best available copies of comic books from the CGC Census. Where would ticket #1,000 be for the earliest appearances of favorite characters? Some winning books may surprise you.
Read more