CGC Census - Submissions, Average Grades, and 76,832 Dots!
An earlier article ( https://comics.gpanalysis.com/news/2020/how-far-do-cgc-average-grades-drop-as-comics-get-older ) explored the differences in average grade associated with higher submission counts and the age of the comic, resulting in a summary table from the 1930s to present.
Average CGC Grade (color coding)

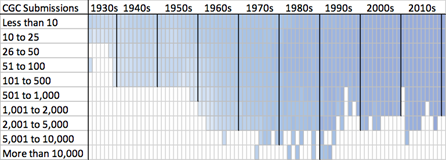
While this table is informative for general purposes, it is not applicable to individual comics. The average grades for Individual comics are not necessarily a match to the overall averages indicated in the chart.
According to the CGC Census of March 22, 2022, CGC has graded 247,434 issues of comic books and comic magazines at least once. The total number of submissions on the CGC Census is 7,340,903.
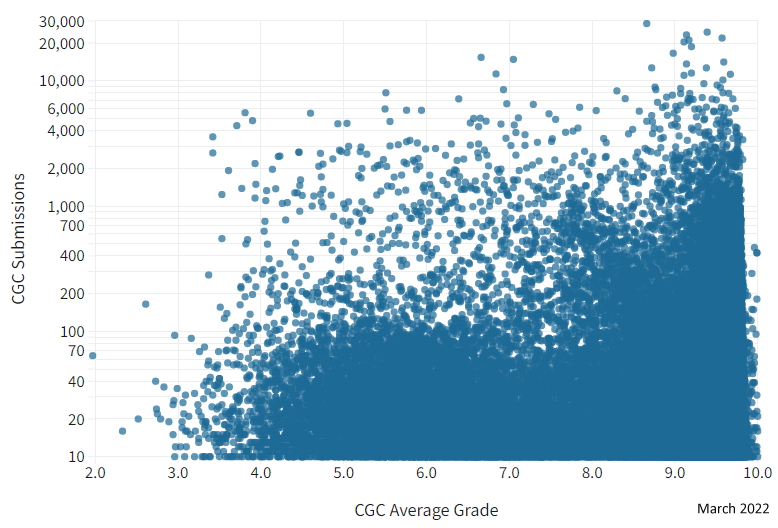
Statistical calculations, such as average grades, are more significant as the quantity increases. For this analysis, removing all comics graded fewer than ten times from the evaluation eliminates 68.9% of the 247,434 issues graded by CGC, but the remaining 76,832 issues have been graded at least ten times each for a total of 6,835,678 submissions, which represents more than 93% of all CGC submissions.
A scatter plot of all 76,832 issues with at least ten CGC submissions results in a hard-to-interpret image of individual dots.
Including a color coding for the decades of publication provides some insight to the general trends of the CGC submissions and average grades. Comics from the 1930s through 1950s are concentrated in the region of 10 to 100 CGC submissions with average grades of about 4.0 to 7.0. The 1960s dominate the center of the graph from 100 to 3,000 submissions and average grades of about 5.0 to 8.5. The 1970s to present are concentrated above an average grade of 8.0 to nearly 9.8 for current issues, even after thousands of submissions.
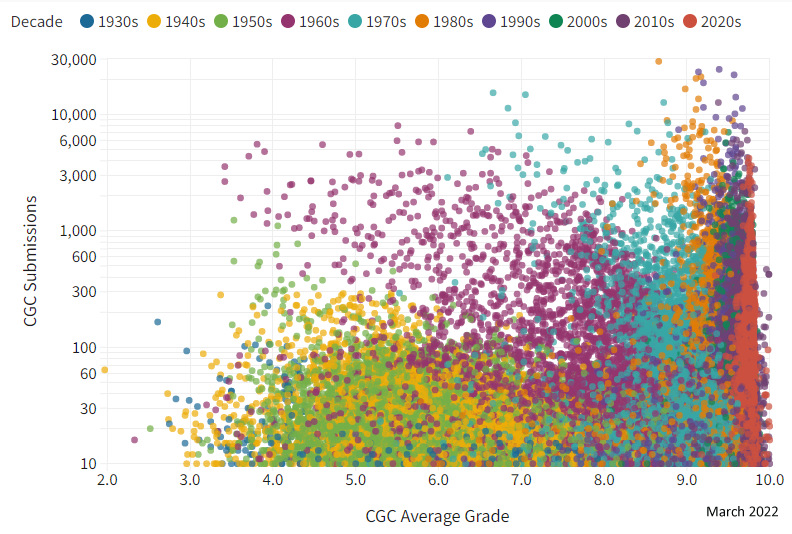
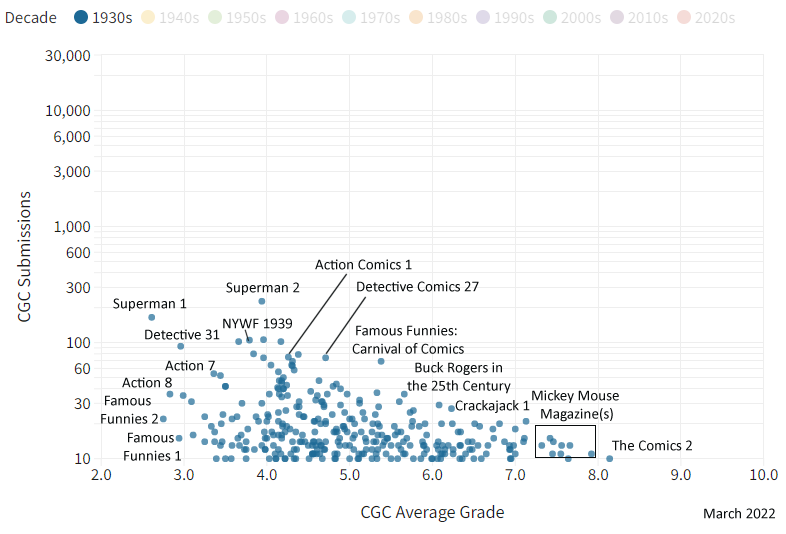
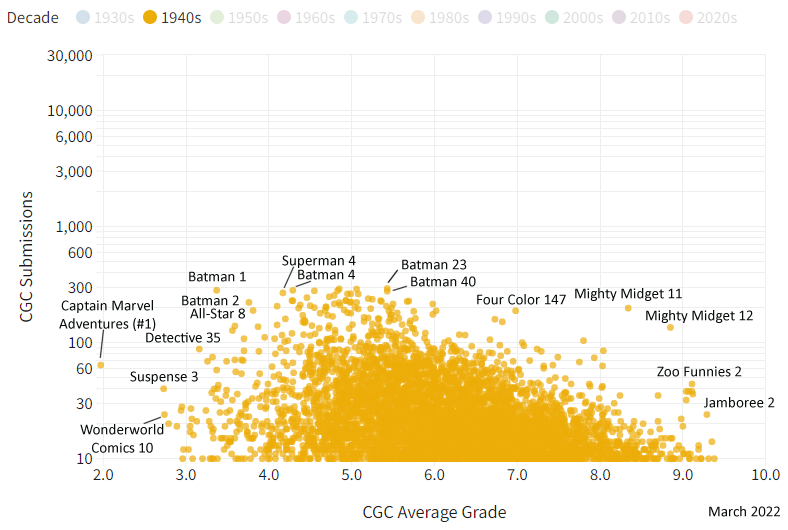
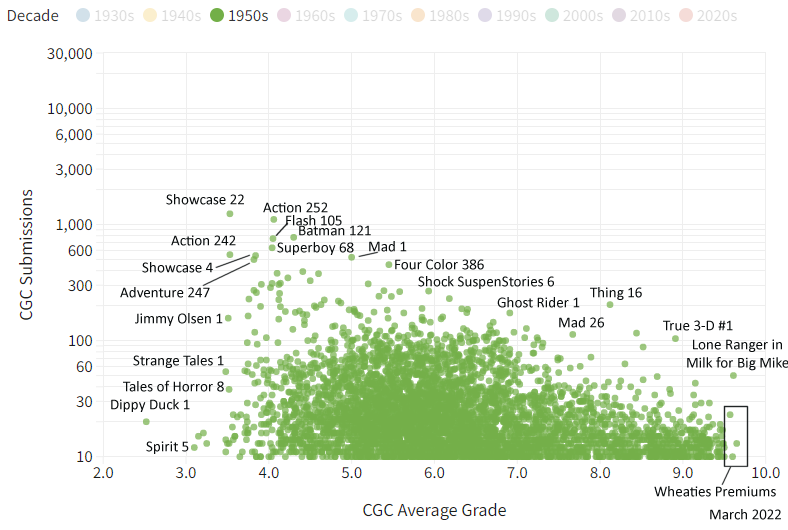
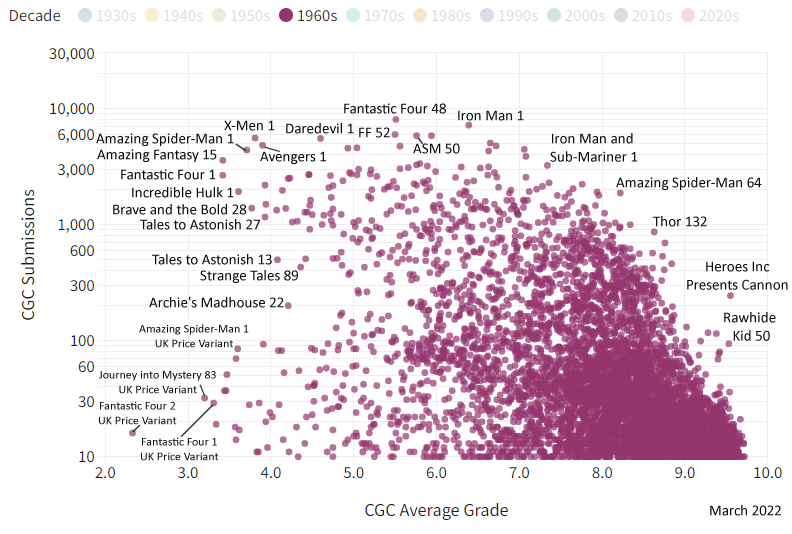
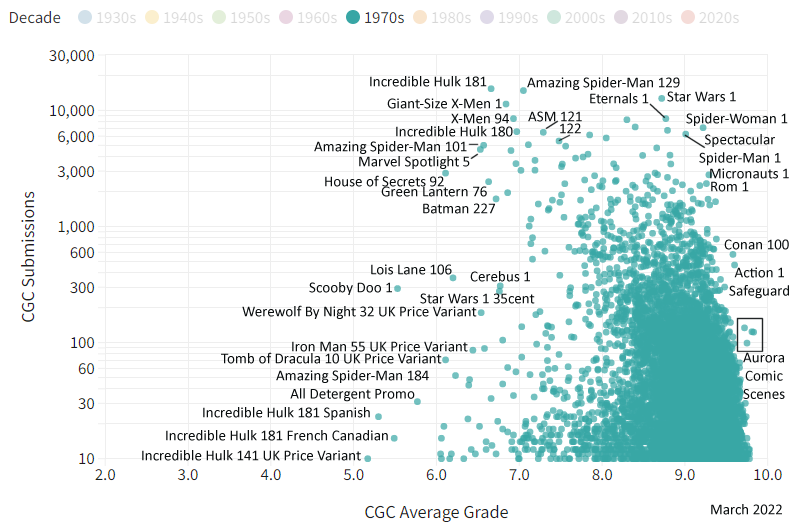
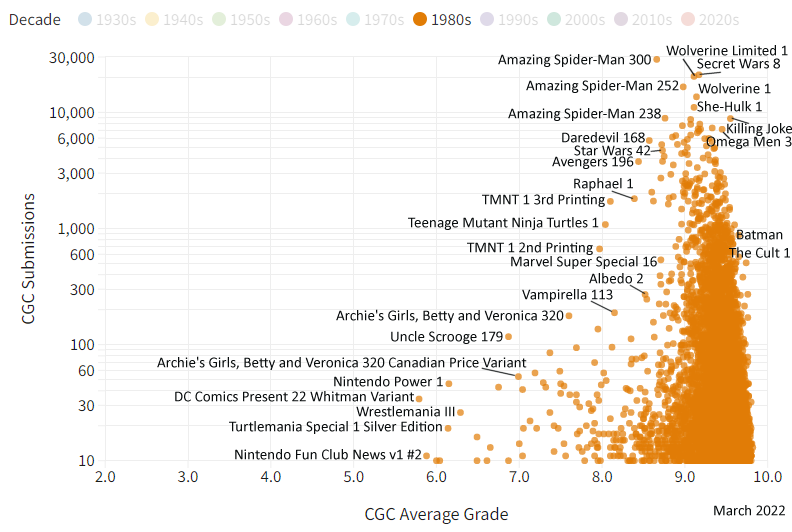
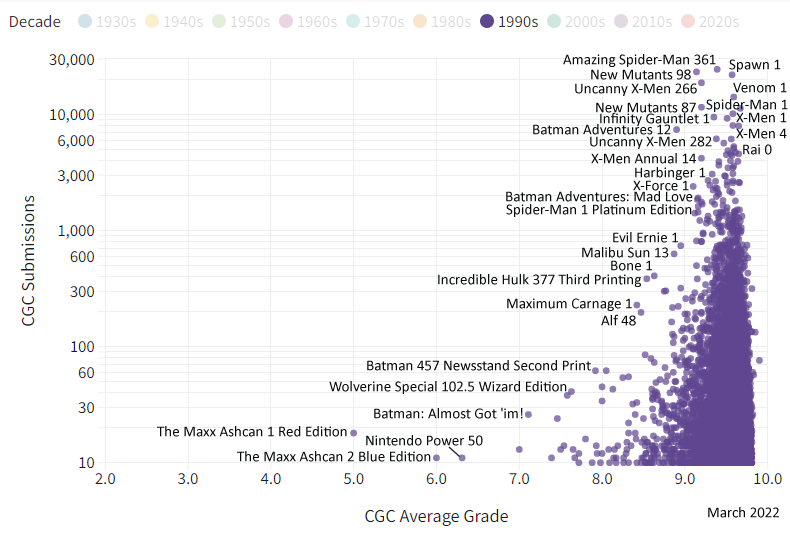
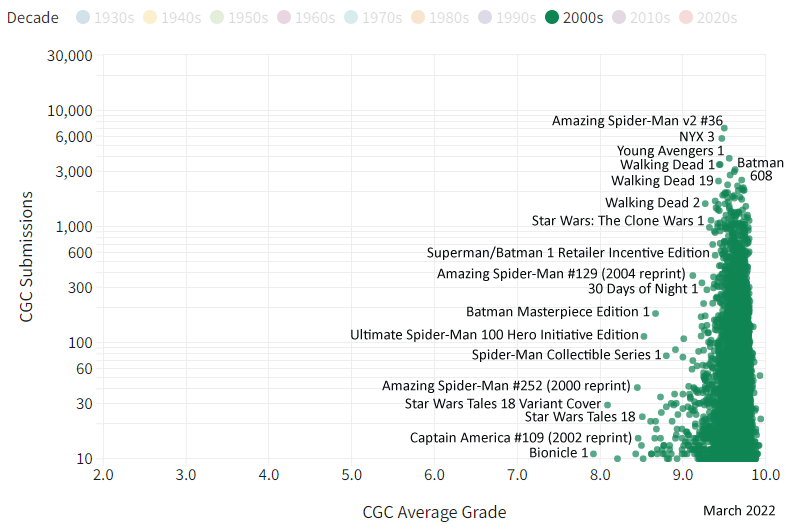
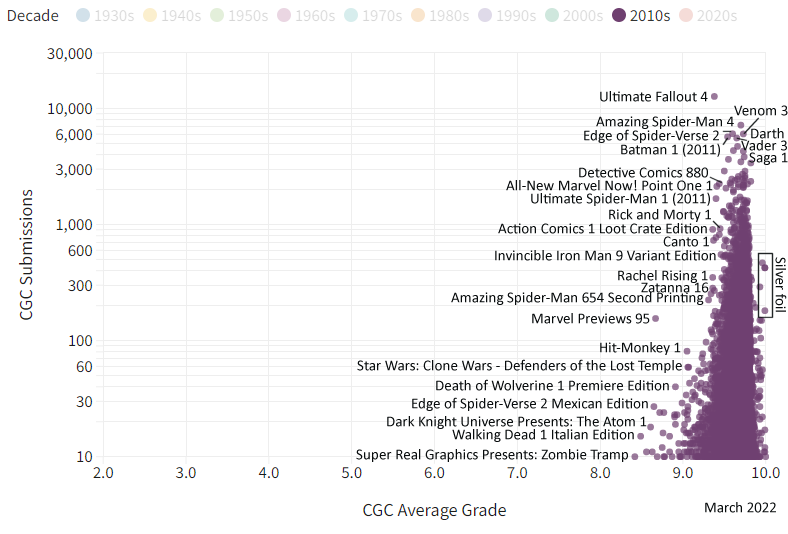
Breaking out this chart by decades allows for inspection of individual issues which stand out (statistical outliers) from the others. Adding notes for the outlier and significant issues allows individual comic books to be identified relative to other issues from each of the decades.
1930s Comics
1940s Comics
1950s Comics
1960s Comics
1970s Comics
1980s Comics
1990s Comics
2000s Comics
2010s Comics
This comprehensive chart, and the selected decade charts, were developed using the CGC Census, compiled at CGCdata.com and visualized with software from the flourish.studio website. The 76,832 dots in the graphic are online and interactive, free for readers to explore.
Link to flourish.studio visualization: https://public.flourish.studio...
About the Author
 |
Greg Holland has collected comic books for over 30 years and has been the administrator of the CGC Census Analysis website since 2003, currently located at CGCdata.com. He is the 1999 founder of the ValiantComics.com website and the 2004 ValiantFans.com message board. Dr. Holland holds a Ph.D. in information quality from the University of Arkansas at Little Rock and has held data science positions as research director, analyst, and administrator for government, corporations, and university. Active on the CGC Forums as ‘valiantman’ since 2002, he is also a 15+ year advisor to the Overstreet Comic Book Price Guide and contributor to later editions of the Standard Catalog of Comic Books. Greg resides in Arkansas, USA, with his wife and their daughter. |
Related news
24 Oct 2022
Canadian Price Variants (CPVs) and GPAnalysis.com Recorded Sales
With Canadian Price Variants recorded in GPAnalysis.com for decades, what can the data tell us about rarity and value when comparing against direct editions?
Read more26 May 2022
CGC Census - A Game for the Thousandth Collector
Imagine a game where 1,000 lucky comic collectors are awarded the best available copies of comic books from the CGC Census. Where would ticket #1,000 be for the earliest appearances of favorite characters? Some winning books may surprise you.
Read more